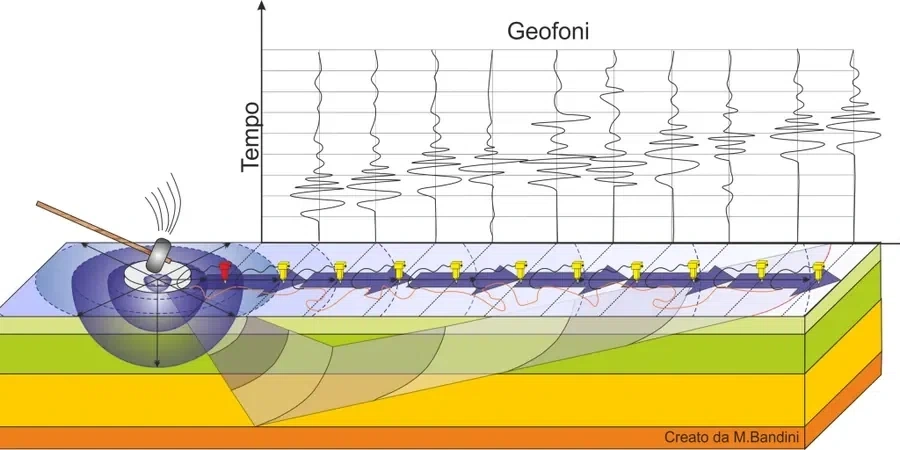
The geophone array stretches across the gravel pad, a 24-channel line with 4.5 Hz vertical sensors spaced two meters apart. In Langley we run these lines over glacial till, over Fraser River silts, and across the compacted fill of new industrial subdivisions near the Golden Ears connector. The sledgehammer source generates a broadband pulse that the DAQ system captures at 0.5 ms sampling—enough to resolve the dispersion curve down to 30 meters and beyond. We process the shot gathers with Multichannel Analysis of Surface Waves (MASW) because the site classification under NBCC 2020 Article 4.1.8.4 depends on the time-averaged shear wave velocity in the upper 30 meters. A single borehole log tells you what the soil looks like; MASW tells you how the soil column will behave when a Cascadia or shallow crustal event sends energy through it. For projects where the stratigraphy is already mapped, combining this dataset with a CPT test refines the stiffness profile at the transition zones between soft clay and dense till.
MASW turns a dispersion curve into a 30-meter stiffness profile—for Langley's glacial till-over-clay sequences, that profile often reclassifies a site and reshapes the structural design.
Method and coverage
Regional considerations
The mistake we see repeatedly in Langley's fast-track commercial projects is relying on the default NBCC site class assumptions—usually Class C or D—without a measured Vs30. A site near the Langley Bypass with 18 meters of soft clay over till can easily fall into Class E, where the short-period spectral acceleration Sa(0.2) doubles compared to Class C. Doubling the design base shear doubles the lateral force-resisting system cost. The other common gap is ignoring the impedance contrast at the till surface: a 1D ground response analysis will amplify certain frequencies at that interface, and if the structure's natural period sits in that amplified band, the performance drifts from code-intended. Running a MASW line costs a fraction of the structural penalty of an unconservative site class. For critical facilities we also recommend a companion liquefaction assessment when the Vs profile indicates loose saturated sands above the till.
Standards that apply
NBCC 2020 Article 4.1.8.4 (Site Classification for Seismic Design), ASTM D5777-18 (Standard Guide for MASW), CSA A23.3-19 Annex L (Seismic design of concrete structures), NEHRP site classification methodology (Vs30-based)
Complementary services
Vs30 Site Classification for NBCC 2020
Complete MASW survey with dispersion analysis, 1D Vs inversion, and formal site class letter stamped by a professional engineer registered in British Columbia. Includes ground-motion parameter extraction per NBCC Table 4.1.8.4.A.
Deep Passive-Source MASW and Microtremor Array
For sites where the till interface is deeper than 40 meters or where active-source energy is insufficient, we deploy a circular SPAC array with broadband seismometers to recover Vs profiles to 100+ meters depth—useful for deep basin effects in the Fraser Valley.
Typical parameters
Top questions
How long does a typical MASW survey take on a Langley site?
A single active-source MASW spread of 24 geophones takes our crew about 45 minutes to lay out, shoot, and verify data quality. Processing and inversion back at the office adds two to three working days. If we are running multiple lines across a large parcel—say a 5-acre industrial lot in Gloucester Industrial Park—the field work can extend to a full day, but the site class determination is generally deliverable within a week.
What does MASW / VS30 testing cost in Langley?
For a standard active-source MASW line with Vs30 determination, NBCC site classification, and a stamped engineering report, costs in Langley range from CA$1,980 to CA$4,490 depending on the number of spreads, line length, and whether passive-source arrays or supplemental borehole correlation are required.
How does the Fraser Valley soil affect shear wave velocity results?
The Quaternary stratigraphy under Langley—glacial till, glaciomarine clay, and post-glacial alluvium—produces a sharp velocity contrast at the till surface, typically around 20-25 meters depth. This contrast dominates the Rayleigh wave dispersion curve in the 12-20 Hz band and must be carefully modeled during inversion. Sites west of 200th Street tend to show thicker soft-clay sequences with Vs in the 120-170 m/s range, while eastern sites on Sumas till outcrop can exceed 300 m/s at the surface.